Mapping Financial Opportunity Project Shows Poor and Black Communities Have Fewer Financial Service Providers
Press Release

Shutterstock
Feb. 23, 2017
Today, New America and researchers at the University of Kansas and University of Michigan launched a new web platform detailing, for the first time, the location of every financial service provider in the United States. Mapping Financial Opportunity (MFO) provides important tools that can be used to identify patterns of inequitable access to financial services and allows communities to explore solutions to the challenges of financial access—and employ these solutions with greater precision.
The MFO website visualizes the locations of financial services (banks and credit unions) and alternative financial services (AFS; e.g., payday lenders, check cashers) nationwide, down to the census tract and street levels. In examining the ratio of financial service providers and AFS and contrasting with race and poverty data for a given location, we found:
As the percentage of Black households in a zip code increases, the density of banks and credit unions decreases. Bank and credit union density is nearly 20 percent lower in zip codes where 50 percent or more of the households are Black compared to all U.S. zip codes.
Bank and credit union density is 35 percent lower in zip codes where 40 percent or more of the households live in poverty compared to all U.S. zip codes.
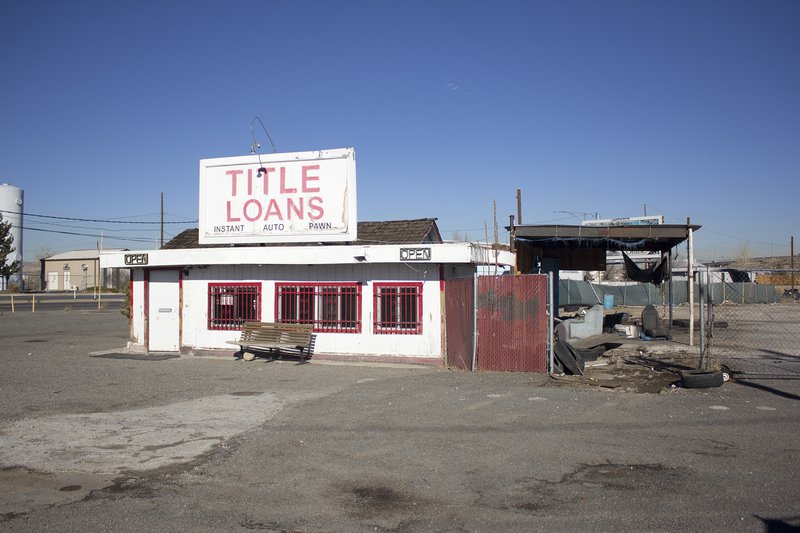
Some communities have especially high densities of AFS relative to banks and credit unions. For example, AFS outnumber banks and credit unions 2 to 1 in Nolan County, Texas and Talladega County, Alabama, where median household incomes are around $36,000 and over a third of their populations identifies as a racial or ethnic minority.
Mat Despard, Assistant Professor of Social Work at the University of Michigan, said: “Communities across the U.S. each have a different mix of financial services such as banks, credit unions, payday lenders, and check cashers. Our research reveals important geographic patterns, such as how the mix of financial services looks different in the suburbs compared to the city, and how the Sunbelt – where population growth is greatest – have fewer banks and credit unions relative to AFS providers like check cashing stores compared to other regions.”
Terri Friedline, Faculty Director of Financial Inclusion at the Center on Assets, Education, and Inclusion, said: “We also wanted to understand our financial system’s physical infrastructure and its relationship to financial health, like whether households are better able to afford their bills based on the concentrations and compositions of financial services in their communities,” said Friedline. “And it’s more than just having a bank nearby to conveniently cash your check. If you live in a community inundated with payday lenders—and absent banks or credit unions—you may start to believe that these alternative financial services are more interested in serving you.”
Justin King, policy director of the Family Centered Social Policy Program at New America said, “Place and policy really matter in determining who can make it in America. We’re thrilled to be helping to shine a light on the ways that inequality perpetuates itself every day in America. MFO opens the door for us to examine the “why” of patterns of inequity in financial access, and work to build greater financial stability and opportunity across the nation.”
The first analyses utilizing the MFO data examine the statistical relationships between variations in financial services and communities’ and households’ financial health, and are available from the Center on Assets, Education, and Inclusion at the University of Kansas:
A Geographic Investigation of Brick-and-Mortar Financial Services and Households’
Financial Health:
The MFO project was funded through a generous grant from MetLife Foundation.