Should Colleges be Worried about the Recent Decline in International Student Enrollment?
Blog Post

Shutterstock
May 4, 2018
Last year’s decline in international student enrollment in the freshman classes has many colleges worried, especially since international students’ tuition payments have become an important source of revenue for these institutions in recent years. Colleges and universities hold the anti-immigration rhetoric and policies of President Donald Trump responsible for the decline, which is the first in more than a decade of consistent growth.
Even though President Trump’s immigration policy is unlikely to change anytime soon, and the decline in first-time international student enrollment is projected to double this year, it’s still early to conclude that the decline signals a major reversal in enrollment trends. Rather than portending a continued decline in international enrollment, the recent dip should be a wake-up call for institutions and policymakers if they want to retain the enrollment of international students. The question is: Are they doing enough to support this population of students?
To help answer this question, I analyzed the U.S. Department of Education’s IPEDS data* on international undergraduates to understand their enrollment trends across all sectors of higher education from 2000 to 2016. The enrollment trends emphasize the need for institutions and policymakers to understand and support this population of students through greater efforts in collecting data, streamlining the visa application process and enhancing accountability measures.Overall Trend of International Undergraduate Enrollment in the U.S.
Colleges and universities in the U.S. currently host more than a million foreign students. The majority of these students has always been at the undergraduate level, except for a period from 2000 to 2010 when the number of international graduate students slightly surpassed undergraduates. The consistent increase in international undergraduate enrollment over years has not only proven the strong interest of young foreign nationals in American higher education but also the interest of American colleges and universities in recruiting this student population.
Except for a dip between 2002 and 2005 due to the after effects of 9/11, enrollment of international undergraduates has risen consistently, growing from just over 200,000 in 2000 to more than 450,000 in 2016 (Figure 1). On an annual basis, international undergraduate enrollment has risen at an average rate of 5.2 percent, twice the annual growth rate of total undergraduate enrollment in the U.S during the same period. The most significant annual increase was from 2013 to 2014 when enrollment of international undergraduates grew more than 11 percent. In 2016 international undergraduates accounted for nearly 5 percent of all full-time undergraduates in the U.S., rising from 3 percent in 2000.
Figure 1: Enrollment trend of international undergraduates, 2000-2016
International Enrollment Across Sectors
International undergraduates are present across all sectors of higher education, be it public, private, or for-profit, four-year or two-year. In 2016, 70 percent of all international undergraduates studied in public institutions, 28 percent in private not-for-profit and 2 percent in private for-profit institution. The pattern has been largely unchanged since 2000 (Figure 2).
While public institutions enroll the most international undergraduates, private not-for-profit institutions have the highest share of international students on their campuses. More than 6.5 percent of full-time undergraduates in private not-for-profit institutions in 2016 were international students, compared to just 4.5 percent in the public and 2.5 percent in the for-profit sector.
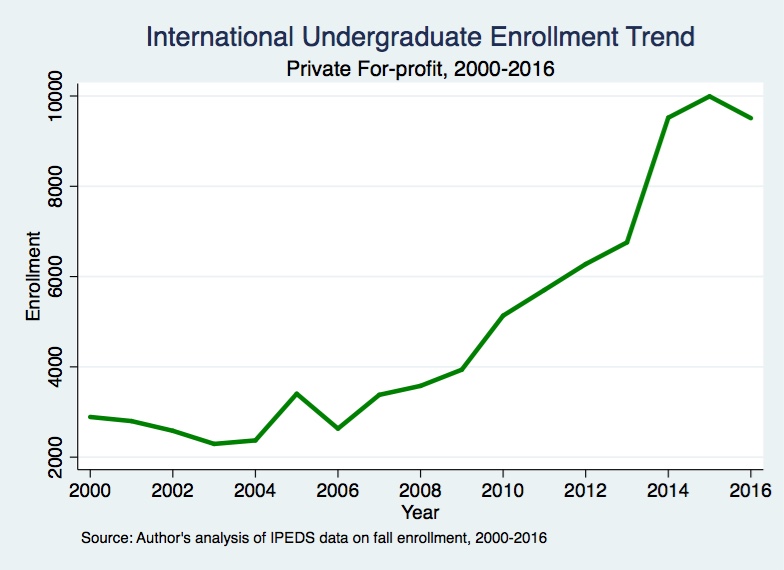
Despite enrolling only a modest number of international students, the for-profit sector has seen the widest increase in international enrollment from 2000 to 2016, which more than tripled from nearly 3,000 to over 9,500 (Figure 3 and 4).
Figure 2: International undergraduate enrollment breakdown by sectors, 2000-2016

Figure 3: Enrollment trend of international undergraduates, 2000-2016

Figure 4: Enrollment trend of international undergraduates in the for-profit sector, 2000-2016
Two-year vs. Four-year Public Institutions
Although most international students in the U.S. study at four-year universities, more than one in ten attended a public two-year community college in 2016. Given the significantly lower tuition of community colleges compared to four-year institutions and the opportunity to transfer to a four-year institution after completion, many international students consider this pathway a more affordable option to study in the U.S.
The share of international undergraduates at public two-year institutions, however, has decreased since 2000. While enrollment of international undergraduates more than doubled from 2000 to 2016 at four-year public institutions, it has been roughly stable in the two-year sector, increasing by only 40 percent over the same time period, making the share of international undergraduates in the public two-year sector drop by nearly 10 percentage points from 27 percent in 2000 to just over 17 percent in 2016 (Figure 5 and 6).
Figure 5: Enrollment trend of international undergraduates in the public sector, 2000-2016

Figure 6: International undergraduate enrollment breakdown in the public sector, 2000-2016

Discussion
The consistent growth in international students across all sectors of higher education not only brings about a substantial financial stream for colleges and universities, but also presents challenges and raises concerns about how to sufficiently support this population of students. IPEDS data only show how international students are present across all sectors of higher education in the U.S., but looking at enrollment data is just the first step to understand this group of students. To serve this group of students better, institutions should collect more comprehensive data, including the academic performance, experience on campus and outcomes after graduation of international students. These data can help institutions provide more targeted support for these students, and if provided publicly and collectively, they are also a helpful and reliable source for international students to make more informed selection of schools.
On the federal policy side, a more relaxed visa policy towards people coming to the U.S. for educational purpose, rather than tightening the rules, will relieve the stress of the visa application process for students. Maintaining and extending the Optional Practical Training (OPT) program, which allows international students to work in the related fields of their studies for a certain period of time after graduating, is also an important factor to attract students. One year as the program allows right now for non-STEM majors (those with STEM majors receive a two-year extension) is clearly not a strong enough incentive for employers to hire and train these students.
Last but not least, given the fact that the international student enrollment is rising in the for-profit sector, any accountability measures applied to domestic students (such as information disclosure for gainful employment programs) should be applied to international students as well, so they are not just used as a no-strings-attached revenue source.
The recent decline in international enrollment is worrisome, but international students will by no means become less present than they are now on American campuses in the near future. The decline should serve as as a warning to institutions and policymakers if they want to retain their international student enrollment. It’s time the focus should go beyond how to increase international student enrollment and the revenue they bring to the institutions, to how best to support and protect them.
*The blog post uses IPEDS data for non-resident undergraduates from 2000 to 2016. Since all international students in the U.S. are full-time students, as required by their visa status, I limit the dataset to full-time undergraduates only. Only U.S. colleges with total full-time enrollment of at least 1,000 students and have reported data on full-time enrollment anytime from 2000 to 2016 are included in the dataset. Overall there are 2,002 universities and colleges in the dataset; more than 60 percent of them are public, nearly 35 percent private not-for-profit and 5 percent private for-profit institutions. Nearly 70 percent are four-or-more year institutions, around a third two-year and very few less-than-two-year institutions, which I also group as two-year institutions.