Comparing State and Nationally Defined Graduation Rates
Blog Post
Oct. 28, 2009
Earlier this month the National Center for Education Statistics (NCES) released a preliminary report on graduation rates in the 50 states and the District of Columbia for the high school class of 2006-07. The report shows that graduation rates vary widely by state - from as high as 88.6 percent to as low as 52.0 percent - and by student race or ethnicity. Interestingly, the NCES figures differ from the graduation rates most states report under the No Child Left Behind (NCLB) Act. In fact, 14 states claim to have graduation rates at least 10 percentage points higher than what the national standard shows. (Data for both nationally and state defined graduation rates can be accessed on the Federal Education Budget Project website at www.edbudgetproject.org.)
NCES calculated graduation rates using a method known as the averaged freshman graduation rate. Under this method, the graduation rate is calculated by dividing the number of diplomas awarded in 2006-07 by the average enrollment of 8th graders in 2002-03, 9th graders in 2003-04, and 10th graders in 2004-05. Averaging 8th, 9th, and 10th grade enrollment controls for freshman students who may have been held back. This method is not as rigorous as a graduation rate produced using longitudinal student data because it does not track individual students as they go through high school. However, in the absence of longitudinal data in the majority of the states, it was deemed preferable to other alternatives in previous studies.
In contrast to the method used by NCES, states calculated 2007 graduation rates in a variety of ways to meet the accountability requirements for NCLB. States were able to choose how they measured graduation rates for NCLB just as they were able to choose state definitions for proficiency in math and reading. Some may have used the averaged freshman graduation rate while others may have just divided the number of diplomas awarded in 2007 by freshman enrollment four years earlier. Some states may even have divided the number of diplomas awarded in 2007 by the number of seniors entering school at the beginning of that school year.
Most of the time, the graduation rate method selected by a state produces a higher graduation rate than what would be produced by averaged freshman graduation rate. For example, the District of Columbia reports a graduation rate of 75.5 percent for NCLB purposes. The NCES calculation gives DC a graduation rate of 54.9 percent, 20.6 percentage points lower. Similarly, Alabama's NCES graduation rate is 16.0 percentage points lower than its NCLB reported graduation rate of 83.1 percent, and Nevada's NCES graduation rate is 15.4 percentage points lower than its NCLB reported rate of 67.4 percent.
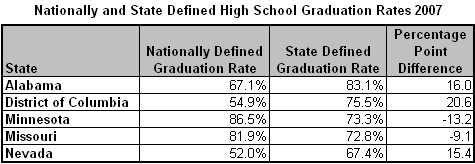
Some states, however, do understate their graduation rates in their NCLB report cards. Minnesota reports a graduation rate of 73.3 percent, 13.2 percentage points lower than its NCES calculated rate. Missouri also reports a graduation rate 9.1 percentage points lower than its NCES rate of 81.9 percent. In total, eight states report a graduation rate lower than the nationally defined rate. Unfortunately, it is impossible to tell what is driving these differences without examining each state's NCLB accountability plan.
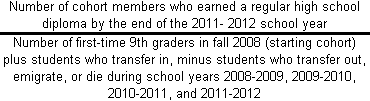
The Department of Education is working to eliminate the disconnect between nationally and state defined graduation rates. For example, recent federal investments in state longitudinal data systems suggest that states will soon be able to calculate graduation rates using individual student data rather than student enrollment and diploma data. Using student longitudinal data would allow states and schools to track students individually as they move from school to school, ensuring a more accurate graduation rate. Additionally, the Department of Education released guidance last December that would require states to report a four-year adjusted cohort graduation rate for the high school class of 2012. This method would calculate the graduation rate as follows:
But standardizing the way graduation rates are calculated is only half the battle. No matter how you look at it, at least 25 percent of American high school students fail to graduate in four years. In an economy that requires at least a high school degree to make a living wage, this trend could spell disaster for economic recovery in the near future.
While both pending House and Senate 2010 education funding bills include $50 million for a new high school graduation initiative, this is just a drop in the bucket what is likely needed to improve graduation rates. America is going to have to get much more serious about providing the support students need to graduate from high school.
A spreadsheet containing data on nationally and state defined graduation rates is available here.