Opportunities and limitations of using data to reach non-filers with the CTC
An overview of data sources and analysis of the zip-level data released by Treasury
Blog Post

Aug. 20, 2021
Executive Summary
This year’s expanded Child Tax Credit (CTC) is poised to cut child poverty in half — but only if it reaches the families who need it most. That means reaching “non-filers,” — very low-income families who are not required to, and often don’t, file taxes. Encouragingly, policymakers and outside advocates have been eager to use data to improve administration of the CTC, and especially to target outreach efforts to these non-filers. There are indeed myriad ways that good data can help us reach unserved families. But just because some data can be helpful does not mean that all data is. This piece explores what outreach organizations can and cannot glean from different datasets intended to facilitate more targeted outreach to non-filers.
First, it is worth noting there are two different ways advocates and government could use non-filer data to improve outreach. On one hand, they could use the actual lists of non-filers to perform direct, targeted outreach. On the other, they could use data to derive relevant trends about where and who non-filers are, trends that outreach organizations could act on. While the former has a lot of promise and should be pursued, there are challenges about how to literally perform the outreach once families are identified, and this piece focuses on the latter.
How can the government develop such lists for analysis? Developing datasets on non-filers is inherently challenging since, by definition, these are people on whom the government — and especially the IRS — has a less-than-average amount of data. Note that one common method is not viable: because the Census Bureau never asks households about tax filing status, standard instruments like the American Community Survey cannot be used to identify non-filers. Instead, there are broadly two methods at the government’s disposal: Census data linked to tax records (which exist, but are extremely sensitive and are not widely available), or data derived from the IRS only (based on the difference between people who appear on information returns like Forms W-2 and 1099, and people who appear on tax returns).
To date, Treasury has released two principal datasets based on the latter method. The goal of both files is to help analysts in deriving large-scale trends about where and how to do outreach, based on the distribution of these non-filers. The first, from September 2020, contained by-zip-code counts of adults who were eligible for stimulus payments but had not yet received them. Though somewhat outdated, this data should provide a reasonably thorough and unbiased picture of where to find non-filer adults. The second, in May 2021, contained by-zip-code counts of children who were likely eligible for Child Tax Credit but had not been claimed on a return. Because of the vagaries of the data generation process (described in more detail below), this dataset is likely to be very incomplete (missing perhaps half of non-filer children), and biased towards areas with higher healthcare coverage, making interpretation difficult. It should be used with caution.
While these files could have contained novel geographic patterns that would have greatly influenced outreach efforts, our analysis below shows that the truth is ultimately not that statistically interesting. There is simply not very much geographical variance in the data: in the May data, half of zip codes have non-filer rates in the 2.3-3.7% range, and in September, half are within 2.6-4.4%. Put differently, in some of the best-targeted zip codes in the country, perhaps up to 1 in 15 families are the right targets for outreach, compared to 1 in 100 in the worst. This is far less variance than the data might have shown.
To further explore the data, we match the zip-level non-filer rates to Census zip-level data on socioeconomic and demographic characteristics, to search for any trends regarding where non-filers are clustered. The September data tells a relatively clear story:
- Zip codes with more poverty and zip codes with more Black and Latino families have more non-filers.
- Zip codes with higher rates of receipt of other benefits have more non-filers.
- Zip codes with more young adults have more non-filers — perhaps people who are not yet in the habit of filing.
- Zip codes with higher educational attainment have more non-filers, which is the reverse of what we might expect. That said, the result disappears in some specifications and may be spurious.
- Zip codes with more seniors have lower rates, but this is likely an artifact of the fact that Social Security recipients had their stimulus payments automated.
- Zip codes with more gig workers have higher rates of non-filers.
Note that most of the power in this model comes from just a few features. Fitting a model based only on the portion of the population identifying as white, the poverty rate, and the portion of the population receiving SNAP or other cash assistance yields very high predictive power.
What is striking about this analysis is that these are all much the same trends that an outreach organization would postulate based on their own intuitions about American society. Tax filing rates are lower in areas with more poverty and more barriers to opportunity. There are very few counterintuitive patterns here — little that would substantively override these basic patterns.
The May data tells a somewhat less clear story, probably largely due to the data generation process. Still, to the degree that there are discernible trends, they largely line up with those in the September data.
In short, non-filers appear to be a relatively small group scattered across the country. A few more live in some areas than others, but outreach is needed everywhere. For outreach in 2021, we recommend that instead of relying on zip-level data, organizers should use their own knowledge of their communities to guide their efforts.
That said, there is plenty of other quantitative work the government can and should do to improve the administration of the CTC, and especially the efforts to reach non-filers. This includes careful analysis of sensitive internal datasets which cannot be publicly released (including linked Census-IRS data and internal IRS data), as well as better processing data on low-income families’ progress through IRS tools and systems.
1. Introduction
The 2021 expansion of the Child Tax Credit (CTC) is poised to be the most significant expansion of the welfare state since at least the Affordable Care Act. But, as we and many others have noted, the new CTC will not reach its full potential if it does not reach those who need it most. And while most families are receiving the new CTC automatically, there is a significant population who will not: families who do not file taxes. Bringing these families — often called “non-filers” — into the system is integral to making the CTC successful. Indeed, it has been a significant focus of our work over the last year, for CTC, stimulus checks, and the Earned Income Tax Credit.
Finding and enrolling non-filers is a significant undertaking — and, naturally, government actors and philanthropists have taken increasing interest in using data to support this effort. The drive to utilize data is a healthy one, and there are plenty of ways in which good data reporting could guide the CTC implementation process:
- Regular reporting on overall CTC coverage rates, by subpopulation, and at a regular cadence — to track progress and focus the effort to reach universal coverage.
- Detailed reporting on the demographics and distribution of non-filers, to look for any trends in non-coverage.
- Processing data for any technology tools that mediate families’ access to the program. For example, this year, it would be very valuable to see data regarding how far users are getting through the new IRS non-filer tool: how many users reach the landing page, how many create an account, how many start a return, how many successfully submit that return. Similarly, it would be valuable to know similar account creation and identity proofing statistics for the CTC Update Portal.
- Processing data for tax returns claiming CTC, to understand how many families are held up in processing, for what reasons.
An item that has attracted special attention lately, though, is the idea of using data to target and refine outreach efforts. Somewhere in the country are several million CTC-eligible families; we can, in principle, use data to help find them. “Using data to find them” could mean two different things:
- Approach 1: Direct Outreach. The IRS — perhaps in association with state and local taxation authorities — could identify the literal individuals who are likely eligible, and perform direct outreach to those exact people. This avenue is very promising, although it comes with challenges. The IRS’s most frequent method of outreach is mail, and mail can be an imperfect way to reach this population. The mailer the IRS used in this vein to promote stimulus checks last year (Notice 1444-A) does not appear to have been entirely successful, with the vast majority of its recipients still not filing taxes. And yet it would arguably be inappropriate and could likely backfire if the IRS cold-called non-filer families — or, worse still, knocked on their doors. State/local agencies or local organizations may be well-positioned to do such direct outreach. But 26 USC 6103 prevents the IRS from sharing such data with most outside actors. The IRS could likely share the data with state and local taxation authorities, who may be able to collaborate with state and local departments of social services — but the process would not be straightforward, and cannot be done overnight.
- Approach 2: Deriving Trends. Data can be used to derive geographic, demographic, and/or socioeconomic trends about where non-filers can be found, which outside groups can then use to target their outreach. But, of course, the success of this strategy depends entirely on how clear the trends are. If the analysis were to find that the overwhelming majority of non-filers were Spanish speakers, or were concentrated in a few given metro areas, or worked in certain industries, or received certain benefits — the analysis could be very helpful. On the other hand, if the trends are weak, and non-filers are scattered throughout the population, this analysis may not be very helpful at all.
Last September and again in May, Treasury released data designed to help analysts pursue the latter route: find geographic or other trends for targeting outreach: certain counts of non-filers at the zip code level. Smart analysts may yet find notable patterns in these datasets. But, to a first order of approximation, while there are some interesting socio-demographic trends to be gleaned from the data, our analysis finds that the trends are too weak to meaningfully inform outreach efforts. There is simply not enough geographic variation in non-filer rates for outreach campaigns to use it and meaningfully improve their efforts beyond what they could infer from basic knowledge of U.S. society.
Before we can get to that finding, it is important to step back and clarify what data is being analyzed.
2. Three possible types of data on non-filers
When it comes to 2021 advance CTC and stimulus checks, some edge cases notwithstanding, eligible taxpayers almost always get the benefit if they file. (Note that this is not true for the earned income tax credit (EITC), where a meaningful number of eligible filers fail to claim the credit.) For AdvCTC and stimulus checks, we can largely collapse eligible households into two categories: filers who get the benefit, and non-filers who do not.
So, how can we tell who non-filers are? Notably, one way we cannot tell who they are is from public survey data. Census data from the American Community Survey (ACS) and from the Current Population Survey (CPS) Annual Social and Economic Supplement (ASEC) are generally the gold standard for studying patterns in benefit receipt. But Census does not ask if respondents filed tax returns, or source this data administratively. Instead, tax data in these datasets come from a Census simulation of what this family should pay in taxes, given their family structure. The simulation simply assumes that everyone who is eligible for tax credits will file and claim all credits they are eligible for — a clearly unworkable assumption when we are trying to determine who does not file. (See more on the Census tax model here.)
Another option is to match survey data to administrative tax records. This has been done; Census-IRS matches are indeed the core of the yearly estimates of what portion of the eligible population receives EITC. But this linked data, sourced from two agencies with very strict data controls, is very sensitive. As such, it is not publicly available, and is indeed not even widely available within the government. This data is the gold standard for in-depth analysis of trends in non-filing; analysts could look for trends between non-filing and the vast array of covariates collected in Census data, and use reliable Census weighting to calculate the size of each non-filing population. The government should take steps to ensure government analysts can do this work. But, it is not feasible to release publicly.
A third option is to use administrative data alone: use IRS data, that is, to identify those who are not filing. Identifying non-filers is challenging with IRS data — after all, the IRS’s best data is on filers. But the IRS in fact has quite a lot of data on non-filers as well from what are called information returns; any person who earns wages (Form W-2), works as a contractor for more than $600 (Form 1099-MISC/1099-NEC), receives taxable state or federal cash benefits (Form 1099-G, SSA-1099, RRB-1099), or has healthcare coverage (Form 1095) is reported to the IRS. Not all people are covered by these forms, but most adults have either some earned income or have benefits income. One estimate is that the income tax system — between tax returns and information returns — covers 99.5% of American adults. If non-filers comprise about 10% of the adult population, this means 95% of non-filers are known to the IRS. So, the IRS can use data from information returns to produce a reasonably comprehensive roster of adults, and then remove those who appear on a tax return (Form 1040) to identify non-filers.
There are two main drawbacks with this approach. First, while it knows their identities, the IRS does not know much else about the non-filers it detects. The IRS will mainly just know their identity (name, SSN/ITIN) and their overall income. It could infer race from last name (although this runs up against IRS policy about race), or derive age from SSA data, though this work isn’t trivial. If the data comes from a W-2, the IRS could cross-reference other documents to look up the industry of employment. The IRS could also look at previous years’ Forms 1040 to determine non-filers’ tax filing history. But this is not the statistical gold mine that ACS data would be. The data is good for the direct outreach approach, but not great for the deriving trends approach.
Second, this dataset cannot reliably account for children. The IRS knows from third parties which adults are earning how much money, but it relies almost exclusively on tax filing to learn which children belong to which adults. There is only one non-1040 source of data the IRS can use to track unclaimed children: Form 1095, which, since the passage of the Affordable Care Act, tracks health insurance coverage, including for children. But where the sum total of W-2, 1099, and 1095 data adds up to pretty comprehensive coverage of American adults, 1095 data alone is missing a pretty significant portion of American children: those without healthcare coverage. Overall, about 6% of children are uninsured. (By comparison, around 8% of children appear to be in non-filer families, based on 88% getting CTC payments, and 96% of families being eligible.) If we assume that non-filers have the same healthcare coverage rate as the rest of the population, then the roster of children created by Form 1095 would be reasonably comprehensive. But this is not likely to be the case; families without health coverage surely are disproportionately likely to be families who do not file taxes. (The covariance of these indicators would be trivial to calculate if Census data contained any reliable information on tax filing.) And if a disproportionate number of uncovered children are also not claimed on tax returns, then the 6% missing from Form 1095 are overwhelmingly likely to be a meaningful portion of the exact children we are looking for when it comes to non-filers.
If that’s true, then data of unclaimed children inferred from Form 1095 is likely to be very incomplete — to a first order of approximation, it is likely to include only around half of unclaimed children. Not only that, but it also represents a biased sample. If State A and State B have the same rate of non-filers but State B has a higher rate of healthcare coverage, then State B will appear to have a higher rate of unclaimed children, since more children will be reported on Form 1095 and will be visible to the analysis. And healthcare coverage rates vary dramatically according to local policy.
In summary:
- Census data alone has no information on whether someone is a tax filer.
- Census data linked to tax records would be the gold standard for deriving trends in non-filing, but this data is generally not accessible to analysts.
- IRS can use its own data to create a reasonably complete roster of non-filing adults, which would serve well for direct outreach. But this data will have limited information on the non-filer adults for purposes of deriving trends, and will contain a very incomplete and biased picture of non-filer children.
3. Publicly available data on non-filers
In an effort to improve outreach for stimulus payments and CTC, Treasury has so far relied on the third approach outlined above: using IRS administrative data to identify non-filers. Two datasets have been created this way.
First, last September, Treasury created a dataset of 9 million adults who appeared eligible for a stimulus payment (that is: had a Social Security Number, and did not have income over the allowed threshold) and had not yet received one. Note that this dataset was searching for those who had not received stimulus payments, not non-filers per se. And indeed, because of the way stimulus payments were administered, these are not the same populations: Many millions of Social Security and Veterans Affairs beneficiaries were issued stimulus payments without having filed taxes. Some of these people may be non-filers of interest for purposes of CTC, but they would not have been in this data. Treasury primarily used the data for direct outreach (issuing Notice 1444-A to the likely eligible non-filers, encouraging them to claim their payments). It also released a version to the public so outside analysts could look for trends. The public version was not microdata with any attributes of individual non-filers; instead it was a table of counts of non-filers by zip code. For privacy, zip codes are not listed independently if they contain fewer than 200 non-filers; those zip codes’ data is aggregated and reported at the state level. The resulting data contains only 31% of zip codes, although these zip codes contain 83.6% of the population and 86.5% of the non-filers.
Second, in May, Treasury created a dataset of all children who are not claimed on tax returns. This data was not used for direct outreach; instead, it was created solely for analysts to use in looking for trends. As the roster was based on data from Form 1095, the universe contained both children and the associated “policy holder” — the person who had the insurance policy on which the child was claimed. To a first order of approximation, this meant parents and children were accounted independently. Again, no microdata about the children was released. Treasury released only by-zip counts of unclaimed children, and Treasury censored zip codes with fewer than 20 policy holders. As this was a more lenient censoring criterion, The resulting data contains 42.4% of zip codes, which contain 91.2% of the population, 94.3% of the policy holders with unclaimed children, and 94.1% of the unclaimed children.
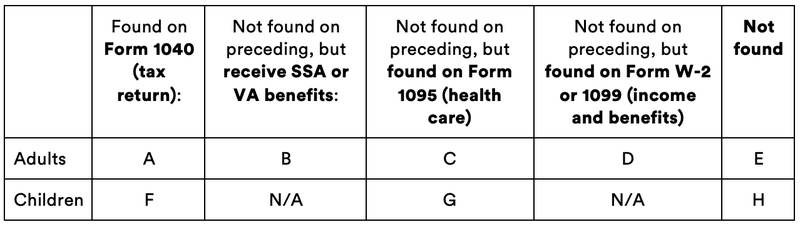
The table below summarizes both datasets. The first dataset contains adults in categories C and D, and is missing adults in E. The second dataset contains children in category G and is missing children in category H.
Summary: populations in data
When it comes to using these datasets to derive trends (rather than just perform direct outreach), there are a few issues.
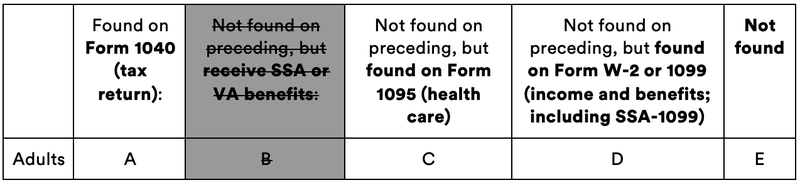
First, the data released last September on adults does not cover exactly the universe that is currently needed to target non-filer outreach, for two reasons. First of all, the data is simply outdated; a lot of outreach has occurred since last fall, which may have brought certain populations disproportionately into the system. Second, and more importantly, remember that this data does not include SSA and VA beneficiaries who automatically received stimulus payments. The outright majority of these people will be seniors who are less likely to have children to claim, though some may. But the list also contains plenty of younger adults on disability insurance or veterans benefits who may well have children. The ideal version of this dataset would not explicitly remove people who receive SSA or VA benefits, and redistribute them to other categories:
Populations in data: alternate
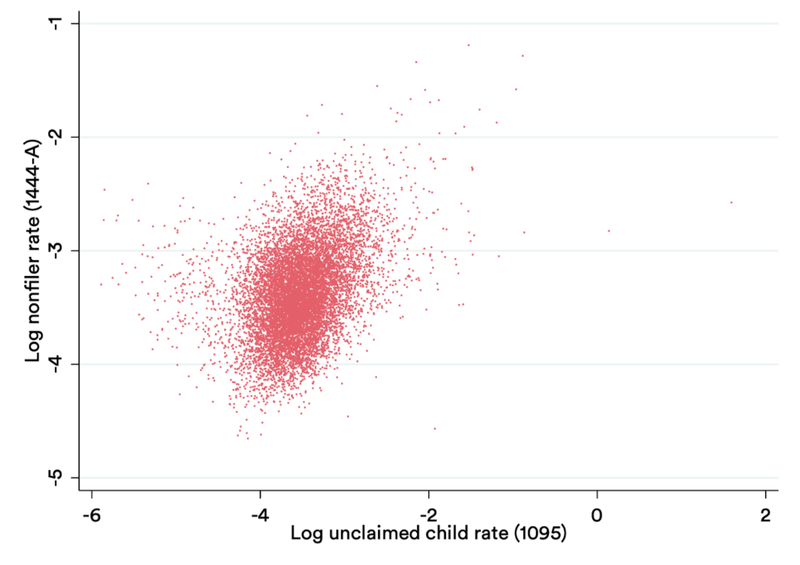
Second, the data released in May on children is, for the reasons discussed above, likely to be incomplete and biased — specifically, it is likely to overstate the number of unclaimed children in areas with high-healthcare coverage, and understate the number in areas with low coverage, since 1095-based unclaimed child rates are a function both of filing rates and healthcare coverage rates. Indeed, that is what we see: The states with the highest rates of unclaimed children (NY, DC, MD, MA) are among the ten states with the lowest uninsured rates. As such, it is a very noisy indicator of where to actually find children, especially given these low overall differences.
If the 1095 data were a reliable indicator of where to find non-filers, we would expect a high correlation between the 1095 and 1444-A data. Instead, the correlation is weak; the correlation coefficient is just .362:
Correlation between May and September Rates
Third, and most importantly — this data again consists only of counts at the zip code level. The data would be sufficient to identify important outreach learnings if: (1) there were a clear geographic pattern to the non-filer rates, with non-filers significantly clustered in certain neighborhoods or certain regions, or (2) the rates were clearly and strongly correlated with actionable zip-level characteristics which strongly implied individual-level trends. But, if such geographic clustering is not present and zip-level trends are weak or trivial, then there is simply not very much that can be done using this data.
Fourth, the majority of zip codes in the country are masked and do not appear in the data for privacy reasons. The vast majority of the population is represented, and so the data would be sufficient to pick up on trends that impact most people — but trends that play out exclusively in small zip codes (which tend to be less dense and more rural) could be missed.
4. Zip-level Treasury data matched to Census data
Keeping these caveats in mind, to further investigate the zip code data, we matched both IRS datasets to 5-year ACS zip-level data. For the September data, we calculated the non-filer rate as the number of reported non-filer adults divided by the number of adults over 18 in the zip code. (This is not exactly the relevant rate, since some of these adults are not eligible for tax credits; but to a first order of approximation it is close.) For the May data, we calculated the unclaimed child rate as the number of reported children divided by the number of people under 18 years old from the Census data.
Zip code tabulation areas from Census do not perfectly align with true Zip codes. This plays out most visibly in the case of 36 zip codes from the September data and 15 zip codes from the May data with non-filer/non-claim rates apparently above 100%. These are all disproportionately small zip codes. For all analysis we drop the 1% of zip codes with the highest non-filer/non-claim rates, assuming these are spurious (representing 0.4% of the population in each case), as well as the 1% with the lowest rates.
Recall that the Treasury data is censored. In the September data, zip codes with fewer than 200 non-filer letters are aggregated and reported at the state level. In the May data, zip codes with fewer than 20 policy holders are aggregated and reported at the state level. The censorship is almost exclusively driven, though, by zip code size. In the September data, among zip codes below 10,000 people, 95% are masked; among zip codes above 10,000, 94% are unmasked. In the May data, among zip codes below 5,000, 93% are masked; among zip codes above 5,000, 92% are unmasked.
We also used HUD data to aggregate the zip codes into counties, for county level analysis.
The data files are available for download below. In these files, the column censored indicates that there is no data from Treasury; the column outlier_drop indicates that this is 1% outlier that should be dropped from analysis; incomplete_data indicates that the zip codes is missing one or more key covariates from the Census side, including potentially the critical denominators.
- September 2020 data — zip code level: Stata / CSV
- September 2020 data — county level: Stata / CSV
- May 2021 data — zip code level: Stata / CSV
- May 2021 data — county level: Stata / CSV
5. Overall amount of variation
Before considering any geographic patterns in the data, we first consider the overall rate of variation by zip code. If there are going to be any clear patterns worth teasing out, there would have to be — at minimum — a relatively high rate of variation.
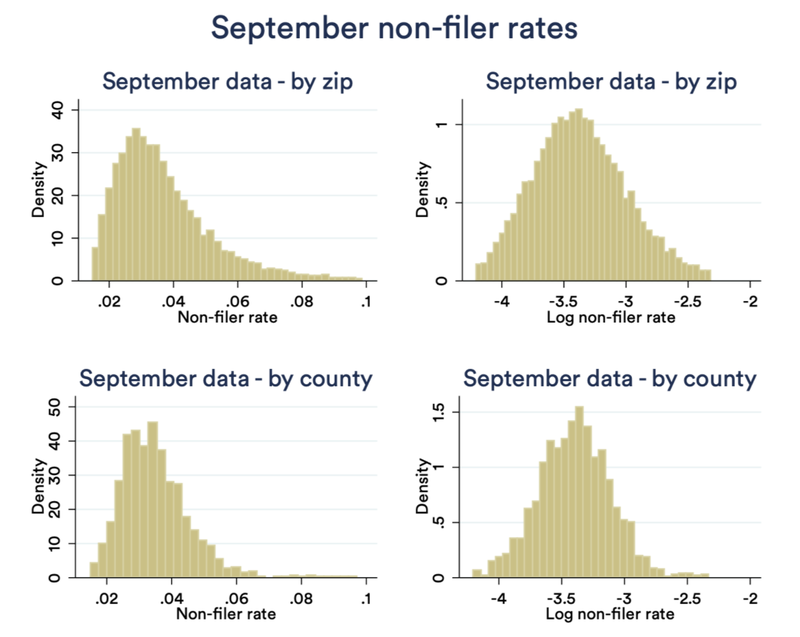
The figure below shows the implied non-filer rate, by zip code and by county, for the May and the September data. Histograms are shown with the true rate (left) and log rate (right).
Variation in non-filer rate — September data
Variation in non-claimed rate — May data
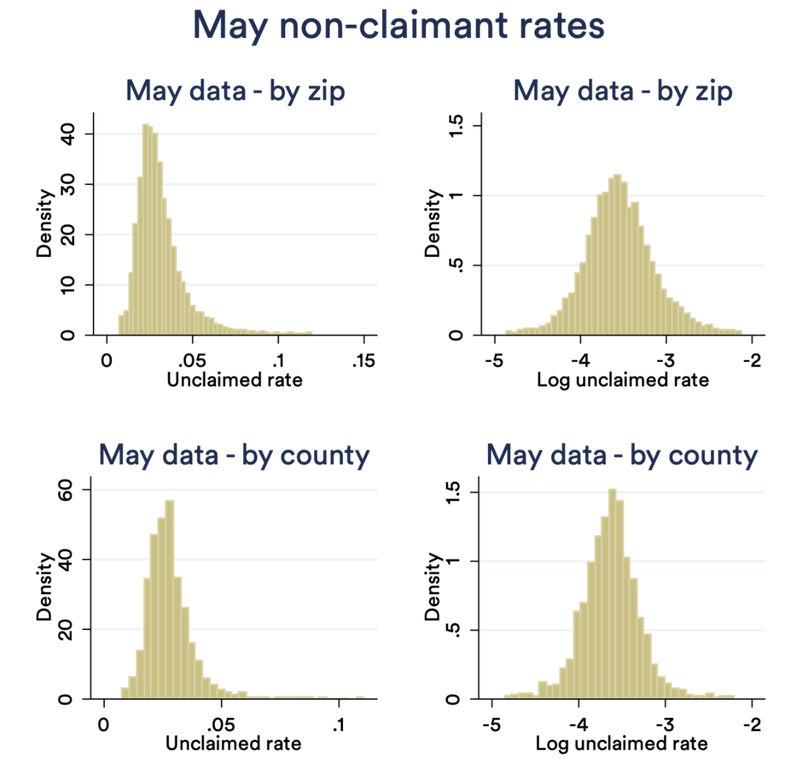
What is striking is how little variation there is. In the May data, half of zip codes are within the 2.3-3.7% range; in September, half are within 2.6-4.4%. While censorship comes into play here, there are nearly no zip codes with less than 1% rates, and only a small handful over 5%. Put another way: in some of the best-targeted zip codes in the country, perhaps up to 1 in 15 families are the right targets, compared to 1 in 100 in the worst. The same patterns hold by county, with even less variation.
6. Patterns by zip code
This low variation does not bode well for the project of assessing zip-level correlations. With that caveat in mind, we undertook such an analysis.
We performed feature selection separately for the September and May data using penalized LASSO regressions, setting lambda via cross-validation at the point of clear diminishing marginal returns. For the September data, as discussed below, we also specify a very sparse model using the same LASSO methodology, with just the three most powerful predictors. The tables below show the results from OLS regressions on the selected features — by zip code and county, with and without weighting by size of county/zip. The dependent variable is log non-filer rate / log unclaimed child rate.
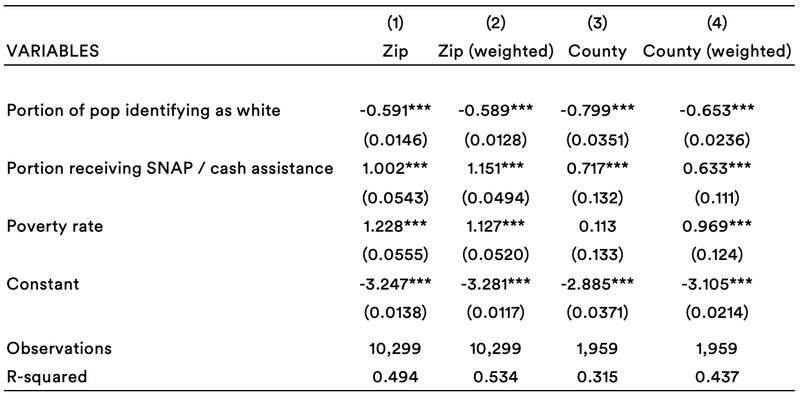
September data — very sparse model
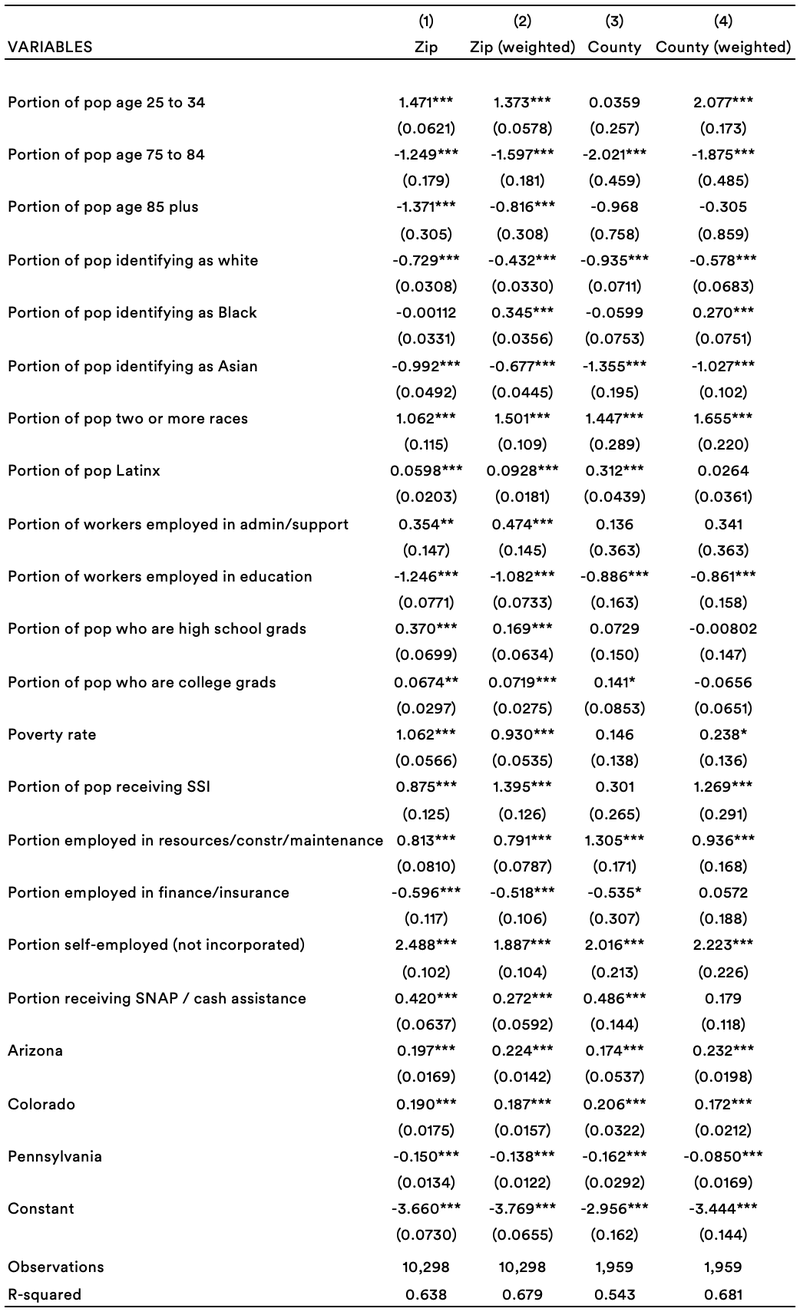
September data — full model
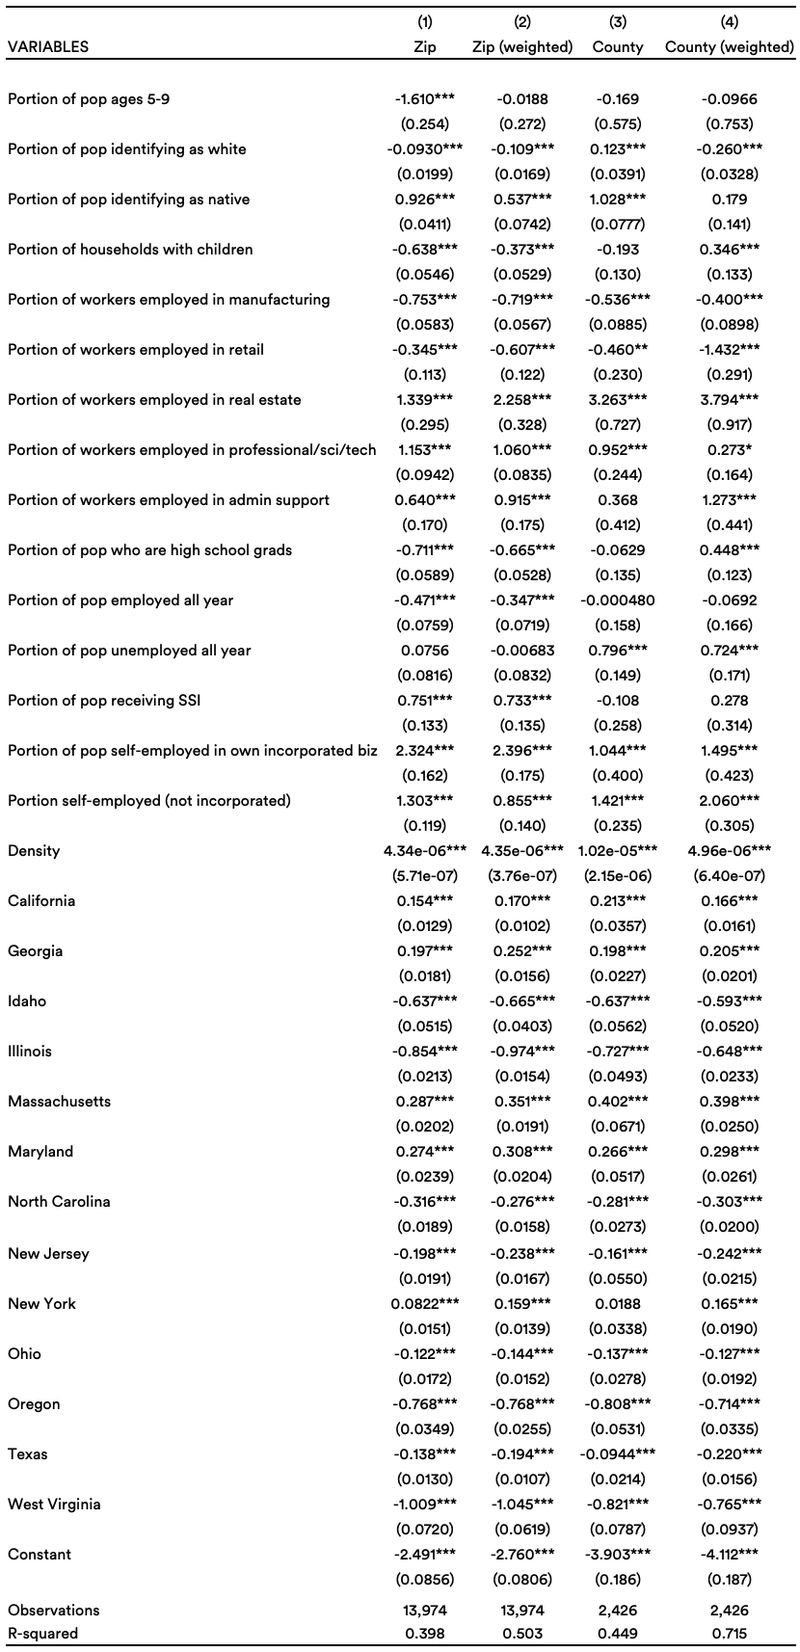
May data — full model
The September data tells a relatively clear story:
- Zip codes with more poverty and zip codes with more Black and Latin people have more non-filers.
- Zip codes with higher rates of receipt of other benefits have more non-filers. One could imagine that populations used to receiving other benefits might file taxes to receive tax benefits too, but it appears not to be the case.
- Zip codes with more young adults have more non-filers — perhaps people who are not yet in the habit of filing.
- Zip codes with higher educational attainment have more non-filers, which is the reverse of what we might expect. That said, the result disappears in some specifications and may be spurious.
- Zip codes with more seniors have lower rates, but this is surely an artifact of the fact that Social Security recipients had their stimulus payments automated.
- Zip codes with more gig workers have higher rates of non-filers.
- There are some patterns around industry that do not, at first glance, tell a clear story.
The predictive power of this model is also relatively high, with an R2 around 0.6. Keep in mind this is an R2 at the zip/county level, which will mechanically be higher than an individual-level model. Put another way, though, there is not much variation across geographies in the first place, and most of what little there is can be explained as a function of these indicators.
Notably, much of this power comes from just the first few covariates. Fitting a sparse model on just the first three features — portion of the population identifying as white, poverty rate, and portion of the population receiving SNAP or other cash assistance — prioritized by the LASSO at high penalties yields an R2 around 0.5.
But, of course, these are just the features any informed social service provider might infer from basic knowledge of American society. Zip codes with more poverty, more people of color, and more usage of other benefits will also have lower tax filing rates. Doing outreach to younger areas and areas with more informal employment may be somewhat novel ideas. But these would only marginally improve the accuracy of geographic targeting. The data is largely just telling us that more disadvantaged places have more non-filers.
The May data tells a less clear story. The specifications all have lower predictive power, and in many cases the same covariates change signs across specifications. Here are some of the clear patterns:
- Zip codes with more children have lower rates of unclaimed children. Perhaps families who live among other families with children are more likely to learn how to claim their children on taxes.
- More dense (that is, more urban) zip codes have higher rates of unclaimed children.
- There are a number of highly significant state effects — consistent again with the idea that state-level differences in health insurance policy are driving much of the variance in the data.
- Zip codes with fewer white people have higher rates of unclaimed children.
- Zip codes with more native people have higher rates of unclaimed children. (Tax credit claim rates are generally low on Indian reservations.)
- Zip codes with more self-employed people have higher rates of unclaimed children.
- Several industries have meaningful predictive power. Zip codes with more people employed in manufacturing and retail have lower rates of unclaimed children; zip codes with more people in real estate, professional/science/technology, and admin/support have higher rates. There is perhaps something of a blue-collar/white-collar divide.
Unlike with the September data, using just a few covariates does not produce a model with comparable predictive power.
It is possible that this May data is picking up on trends that are highly counterintuitive to providers doing outreach. But it seems more likely that some of the messiness simply has to do with the strangeness of the data generation process — with rates, again, a function of both health care coverage rates and tax filing rates, with those components pointing in different directions. Providers could eschew low-income neighborhoods with lots of families in favor of dense urban neighborhoods with more white-collar workers and fewer children overall — but it is hard to imagine this would not backfire, despite what the data appears to suggest.
Overall, this analysis does not yield very much actionable insight for outreach. In the more reliable September data, by far the clearest indicators are exactly those that outreach organizations would rely on intuitively. The May data largely shows strange patterns, likely because of the data generation process. The analysis reveals a few interesting and non-obvious connections, but nothing highly actionable in the fight to actually reach every family in need.
7. Conclusion
It is exciting that policymakers and outside advocates alike are eager to use data to improve administration of the CTC, and there are myriad ways that good, prompt data can help reach unserved families. But just because some data can be helpful does not mean that all data is.
Releasing zip-level data was a valuable experiment (indeed one we and other advocates had called for): it certainly could have contained novel geographic patterns that would have greatly influenced outreach efforts. But the truth is ultimately not that interesting. There is not huge geographical variance; non-filers are a small group scattered across the country. A few more are in some areas than others, but outreach is needed everywhere. When we try to tease further details out of this, we find in the September data simply the same basic patterns we expect about the geography of opportunity in the U.S. The May data meanwhile is generated from a process that very greatly complicates its interpretation. For outreach in 2021, organizers would be well-advised to tune out the zip-level data and use their own knowledge of their communities.
But there is plenty of other analysis the government can and should do to improve the administration of the CTC. First, analysts at Census or the IRS should do individual-level analysis on CTC-non-recipients using linked ACS and IRS records. Second, analysts at the IRS should do individual-level analysis of non-filers using the same universe as the public-use files but using microdata that cannot be made publicly available — on age, industry, family structure, income, race (based on statistical models), and tax filing history. Third, the IRS should be tracking returns from these families, and tracking their usage of IRS tools, to find and address any issues in the CTC pipeline. These are just a few of many projects that would advance efforts to reach every family with the benefits they need.